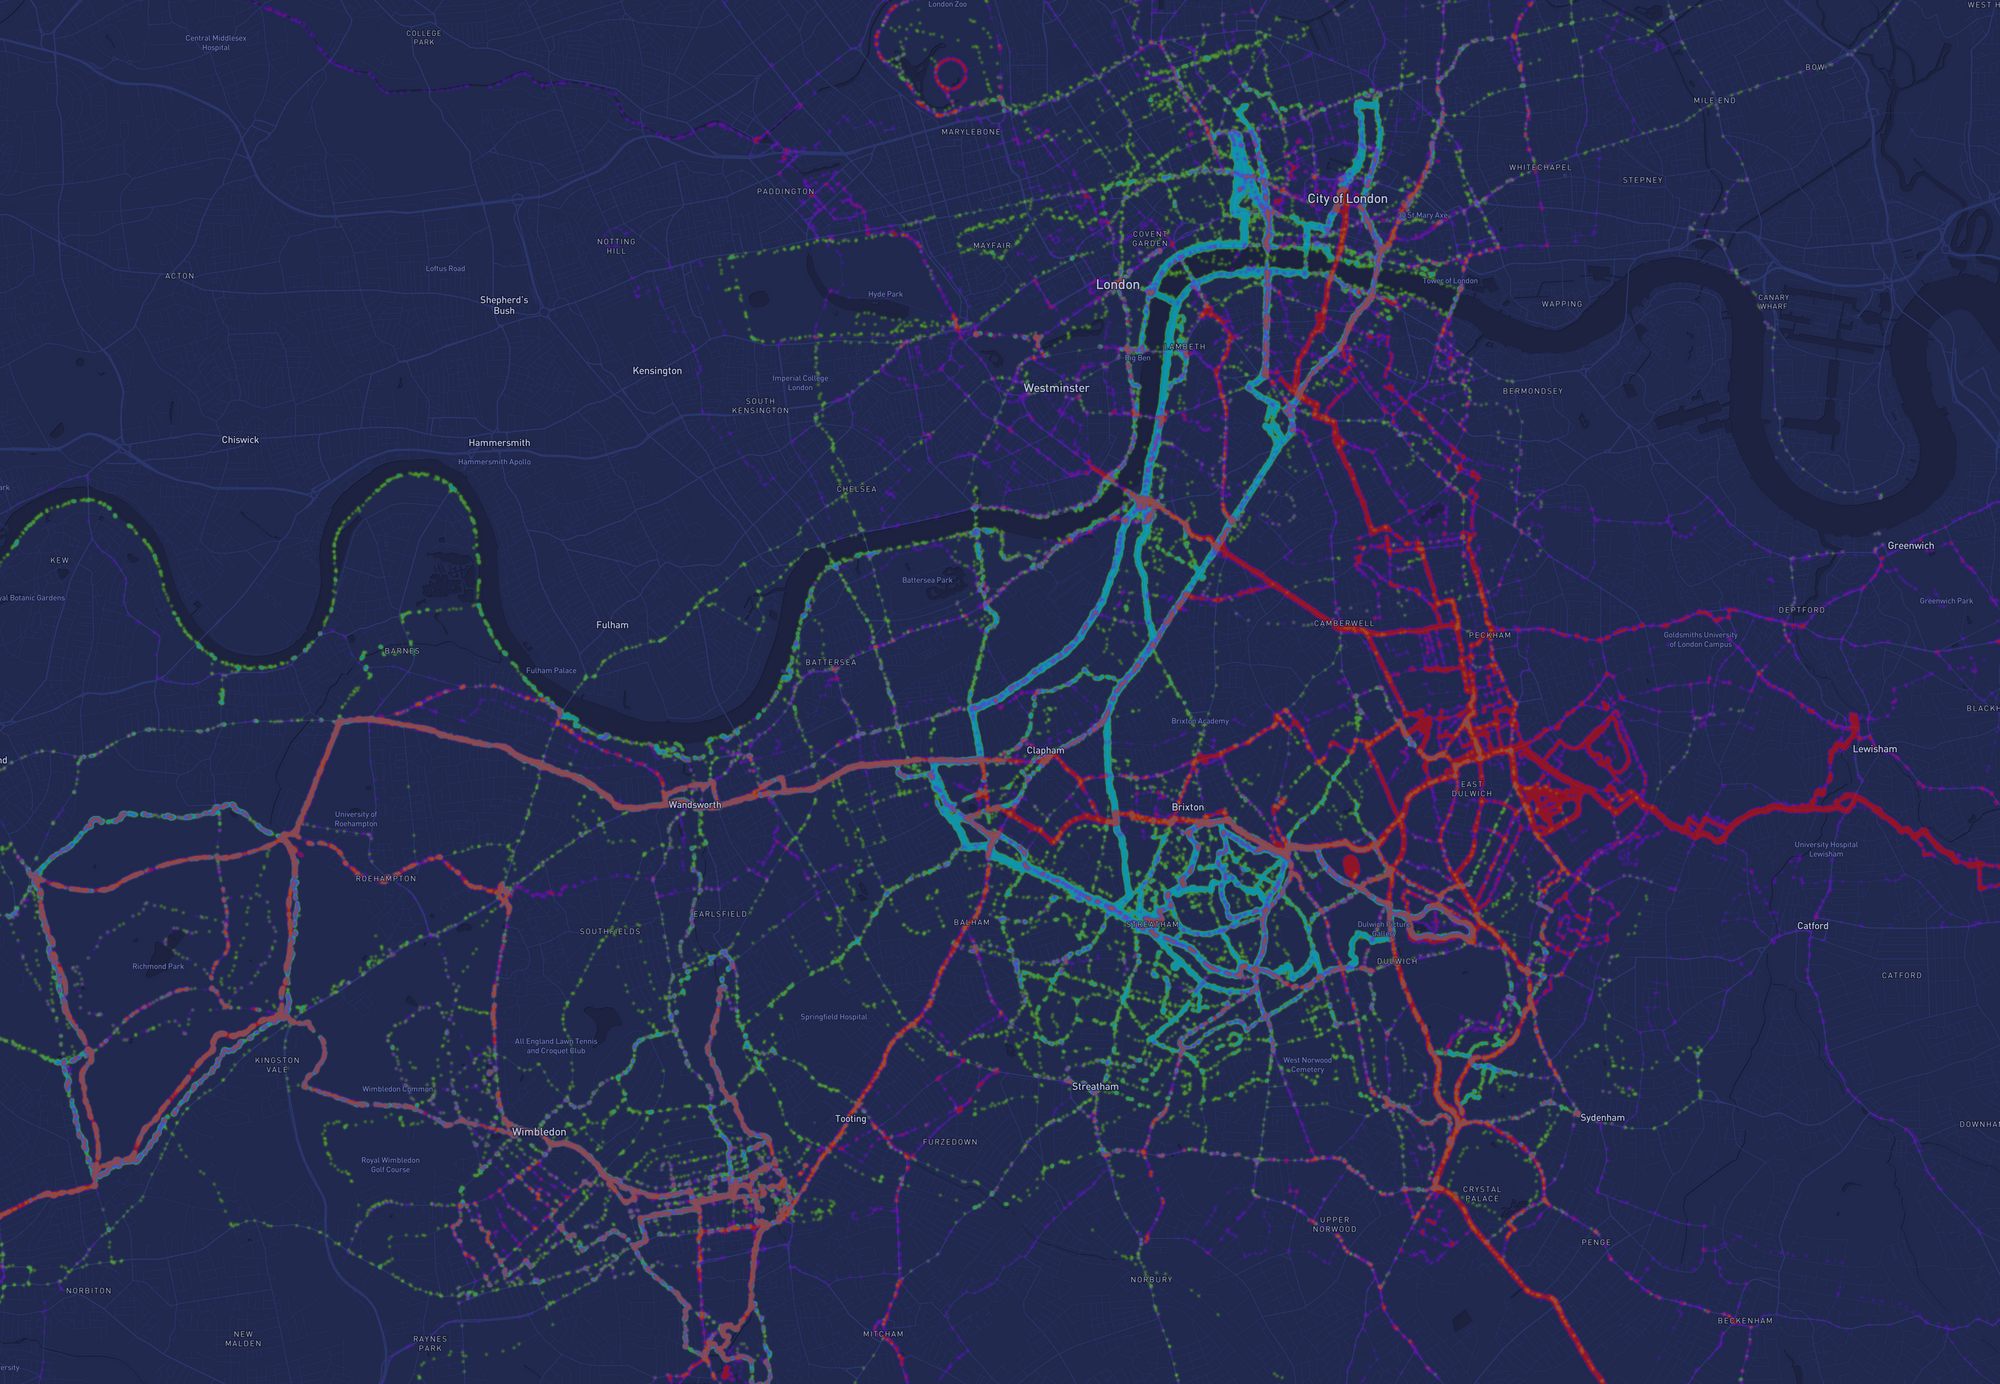
Personal Activities Heatmap
How I went about making a personal activities heatmap using mapbox and strava

© Mapbox, © OpenStreetMapSo Strava makes these things called heatmaps which overlays all your activities on a map. There is a very cool global interactive version available here.
They will show you your own personal version if you pay for a premium subscription. I wanted one to print out and hang on a wall. This you cannot pay for. So I decided to make one myself.
Step 1: Data
Downloading your personal archive from strava is pretty easy- you get a big zip file with all your activities and photos you've uploaded. Instructions for doing this are here.
Step 2: Convert to GeoJSON
The next step was not so easy. I ended up having to write a script that goes through all these files, pulls out the GPS data converts it to GeoJSON format. I've published the code for this here. Its pretty rough, but does the job.
Step 3: Make a map
After that it was relatively easy. Mapbox has a great tool called Studio. The free tier on mapbox is relatively generous and allows you to upload the GeoJSON file and put it on a map and have all the control you'll even need in terms of colours, fonts, formatting and so forth. You can then export it too. They allow exporting up to and 8000x8000px png.
This step may have been easy, but definitely took the longest. I ended up exporting 6 different images and then stitching them together to get something big enough for an A1 size poster. Top tip: Use the URL in mapbox studio- this allows you to keep one coordinate fixed and move by a fixed amount for every export. Make stitching them together a lot easier.
Conclusion
Now a word about why the heatmap in the image above has so many colours. It contains two people's data. So my data is green and blue with blue being areas that are more used than others. My partner's activities are purple and red, with red being the more used areas.
Each of these heatmaps is was then set to an opacity of 50% allowing them to mix together (The orange colour) and so the heatmap shows all of our activities, how often we did a certain route and which routes we did together.

© Mapbox, © OpenStreetMap


